Transcript
0:00Noncompartmental analysis
Lesson 6.7 of our pharmacokinetic models module: noncompartmental analysis. Noncompartmental analysis, or NCA, calculates the parameters of a drug from the plasma concentrations of one person at set times. Plasma is the liquid part of the blood. The area under the concentration-time curve, the AUC, measures the total exposure to the drug. Clearance, CL, is the volume of plasma from which the body removes all of the drug per unit of time. After an oral dose, the analysis gives the apparent clearance, CL over F. F, the bioavailability, is the fraction of the dose that reaches the systemic circulation unchanged. The volume of distribution relates the amount of drug in the body to the plasma concentration.
1:04AUC to the last sample
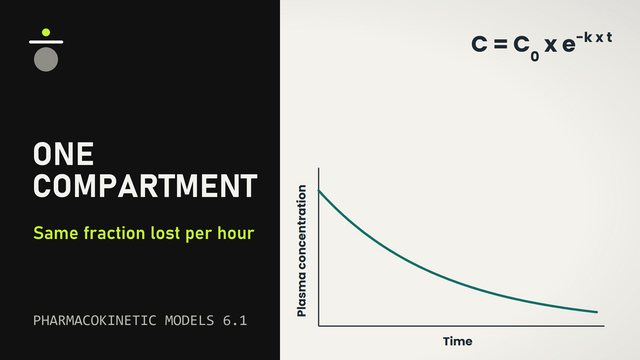
The first of five steps is the AUC to the last sample, the area from the dose to that sample. Cmax is the highest measured concentration, and tmax is its time. The trapezoidal rule adds the areas under straight lines between consecutive points. The linear-up/log-down method uses straight lines where the concentration increases, and straight lines on a logarithmic scale where it decreases. After absorption ends, the concentration falls by about the same fraction in each hour, and the log-down line follows an exponential decay exactly. A straight line lies above the decay, so the linear rule overestimates the area, more so for a longer time between samples.
2:01Terminal phase and half-life
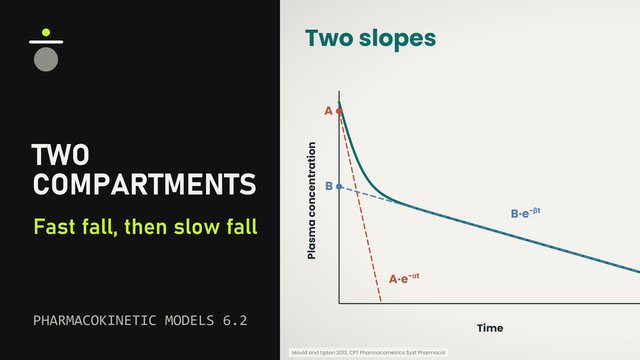
The second is the terminal phase, the last phase of the curve, and its rate constant, lambda z. On a plot of the natural logarithm of the concentration against time, this phase is a straight line with the slope minus lambda z. NCA software such as NonCompart fits a line to the last three points. The software then adds one earlier point at a time, back to the first point after tmax. It keeps the fit with the highest adjusted R squared, the R squared corrected for the number of points. The FDA recommends three or more points. The terminal half-life, the time for the concentration to fall by half in this phase, is 0.693 divided by lambda z.
2:56AUC to infinity
The third is the AUC to infinity. Clast, the last measured concentration, divided by lambda z is the area after the last sample. The AUC to infinity is the AUC to the last sample plus this area. The extrapolated percentage is this area divided by the AUC to infinity, times 100. A bioequivalence study compares two products of the same drug. For these studies, the International Council for Harmonisation recommends an AUC to the last sample of at least 80 percent of the AUC to infinity. The extrapolated percentage is then at most 20 percent.
3:48Clearance and volume
The fourth is the clearance and the volume of distribution. The dose divided by the AUC to infinity is the clearance after an injection into a vein, and CL over F after an oral dose. Vz, the volume of distribution in the terminal phase, is the clearance divided by lambda z. After an oral dose, the same division gives the apparent volume, Vz over F.
4:20Mean residence time
The fifth is the mean residence time. The AUMC is the area under the curve of time multiplied by concentration. The mean residence time, MRT, is the AUMC divided by the AUC. After a single rapid injection into a vein, the MRT is the mean time that the drug stays in the body. Vss, the volume of distribution at steady state, is CL multiplied by MRT when the clearance is the same at every dose. After an oral dose, the MRT includes the mean absorption time, so this product differs from Vss.
5:10Theophylline: AUC and half-life
The theophylline data set shows each step for one subject. Theophylline treats asthma. A paper on the R package NonCompart prints the 11 concentrations of subject 8, who took an oral dose of about 320 milligrams. Cmax was 7.56 milligrams per liter, and tmax was 2.02 hours. The linear rule gave an AUC to the last sample of 88.6 milligram hours per liter. The linear-up/log-down method gave 86.8, 2 percent lower, mostly from the last 12-hour interval. The adjusted R squared rose from 0.965 with three points to 0.989 with six points. Lambda z was 0.0815 per hour, and the terminal half-life was 8.5 hours.
6:17Theophylline: AUC to infinity, CL/F and MRT
The area after the last sample was 15.3, so the log-down AUC to infinity was 102 milligram hours per liter. The extrapolated percentage was 15 percent, below the 20 percent maximum of the bioequivalence criterion. CL over F was 3.13 liters per hour, and Vz over F was 38.5 liters. The MRT was 12.9 hours. The extrapolated part was 42 percent of the AUMC and 15 percent of the AUC, so lambda z affects the MRT more than the AUC.
7:05Summary
In summary, Cmax and tmax come from the data, and the log-down AUC was 2 percent lower than the linear AUC. Lambda z comes from the fit with the highest adjusted R squared among three or more points. In bioequivalence studies, the extrapolated percentage should be 20 percent or less, and here it was 15 percent. CL over F is the dose divided by the AUC to infinity, and Vz over F is CL over F divided by lambda z. The MRT is the AUMC divided by the AUC. Vss is CL multiplied by MRT only after a single rapid injection into a vein, with the same clearance at every dose. This concludes lesson 6.7 on noncompartmental analysis.
Sources
- Kim H, Han S, Cho YS, et al. Development of R packages: 'NonCompart' and 'ncar' for noncompartmental analysis (NCA). Transl Clin Pharmacol. 2018. PMID 32055542
- Benet LZ, Sodhi JK. Simplifying pharmacokinetics, applying it to drug and dosage form development, and making drug dosage decisions in clinical medicine: the adaptation of Kirchhoff's laws from physics. AAPS J. 2025. PMID 40603610
- Yim DS. Tutorial for beginners: the concept of clearance explained using the example of a vacuum cleaner. Transl Clin Pharmacol. 2017. PMID 32095451
- Toutain PL, Bousquet-Mélou A. Volumes of distribution. J Vet Pharmacol Ther. 2004. PMID 15601439
- US Food and Drug Administration. Bioavailability studies submitted in NDAs or INDs: general considerations. Guidance for industry. 2022. https://www.fda.gov/media/121311/download
- Liu G, Brooks L, Canty J, et al. Deep-NCA: a deep learning methodology for performing noncompartmental analysis of pharmacokinetic data. CPT Pharmacometrics Syst Pharmacol. 2024. PMID 38465417
- Chiou WL. Critical evaluation of the potential error in pharmacokinetic studies of using the linear trapezoidal rule method for the calculation of the area under the plasma level-time curve. J Pharmacokinet Biopharm. 1978. PMID 731416
- Bae KS. NonCompart: noncompartmental analysis for pharmacokinetic data. R package version 0.8.4, reference manual. 2026. https://cran.r-project.org/web/packages/NonCompart/NonCompart.pdf
- Scheerans C, Derendorf H, Kloft C. Proposal for a standardised identification of the mono-exponential terminal phase for orally administered drugs. Biopharm Drug Dispos. 2008. PMID 18098336
- Toutain PL, Bousquet-Mélou A. Plasma terminal half-life. J Vet Pharmacol Ther. 2004. PMID 15601438
- International Council for Harmonisation. M13A Bioequivalence for immediate-release solid oral dosage forms. ICH guideline. 2024. https://www.pmda.go.jp/files/000269966.pdf
- European Medicines Agency. Guideline on the investigation of bioequivalence. 2010. https://www.ema.europa.eu/en/documents/scientific-guideline/guideline-investigation-bioequivalence-rev1_en.pdf
- Yamaoka K, Nakagawa T, Uno T. Statistical moments in pharmacokinetics. J Pharmacokinet Biopharm. 1978. PMID 731417
- R datasets package. Theoph: pharmacokinetics of theophylline (source: Boeckmann AJ, Sheiner LB, Beal SL. NONMEM Users Guide, Part V. University of California, San Francisco. 1994). https://vincentarelbundock.github.io/Rdatasets/doc/datasets/Theoph.html
Illustrations adapted from Servier Medical Art (smart.servier.com), CC BY 4.0. Structures drawn with RDKit.