Transcript
0:00Repeated doses
Lesson 6.3 of our pharmacokinetic models module: repeated doses. Many treatments give a drug as a series of doses at fixed times. The dosing interval is the time from one dose to the next. Elimination is the irreversible loss of drug from the body by metabolism and excretion. Plasma is the liquid part of the blood. The half-life is the time for the plasma concentration to fall by half.
0:35Accumulation
If a new dose comes before the body eliminates all of the previous dose, the drug that is left and the new dose add together. Accumulation is the amount of drug left in the body from earlier doses.
0:52Peak, trough and steady state
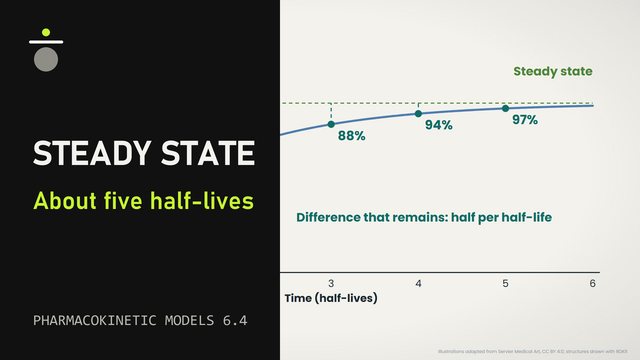
After each dose, the plasma concentration rises to a peak, the highest concentration in the interval. It then falls to a trough, the lowest concentration, just before the next dose. With each new dose, the peak and the trough rise, but by smaller steps. The peaks and troughs approach a level at which each dose replaces the drug eliminated in one interval. This condition is called steady state.
1:26The accumulation ratio
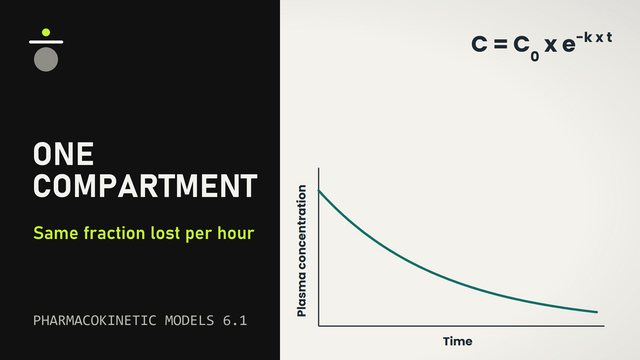
The area under the plasma concentration curve, AUC, measures the exposure to the drug over a period of time. The accumulation ratio, R, is most often the AUC over one interval at steady state, divided by the AUC over the first interval. In the simplest model, the body is one well-mixed space that eliminates the same fraction of the drug in each hour. Each dose enters the blood at once, as with an injection into a vein. If f is the fraction of a dose left at the end of one interval, R equals 1 divided by 1 minus f. In the simplest model, the interval and the half-life set two properties: the accumulation ratio and the fluctuation of the concentration within each interval.
2:26Effect of the dosing interval
The first is the accumulation ratio, set by the interval relative to the half-life. When the interval equals the half-life, half of each dose is left when the next dose comes, so R is 2. With an interval of half the half-life, about 71 percent is left, and R is about 3.4. With an interval of two half-lives, 25 percent is left, and R is about 1.3. In this model, R is the same for every dose size.
3:05Fluctuation
The second is fluctuation, the change of the concentration within one interval. The peak-to-trough ratio, the peak divided by the trough, measures it. In the simplest model, at an interval equal to the half-life, the trough is half the peak. A longer interval gives a larger peak-to-trough ratio and a smaller R, and a shorter interval gives the opposite. In this model, the same dose per day gives the same average concentration at steady state for any interval. Smaller doses given more often therefore keep the same average with a smaller fluctuation.
3:51Apixaban and the accumulation ratio
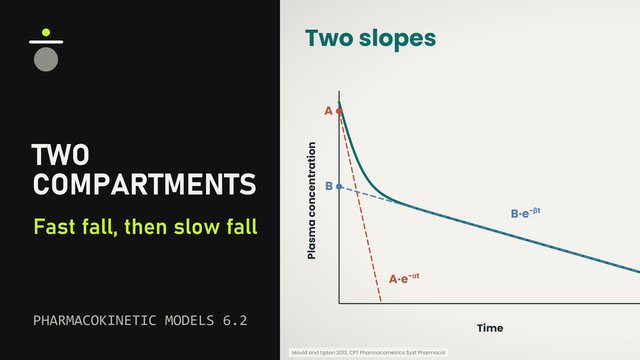
Two studies of apixaban, an oral drug that reduces blood clotting, show both properties. The first measured an accumulation ratio close to the value that its half-life predicts. Twelve healthy Chinese adults took one 10-milligram dose, and from day 4, 10 milligrams every 12 hours for 6 days. The terminal half-life, the half-life of the final, slower fall, was about 11 hours after the single dose and after the repeated doses. R was the AUC over 12 hours on the last day, divided by the AUC over the first 12 hours. The interval of 12 hours was close to the half-life. In the simplest model, the half-life predicts that a little less than half of each dose is left at the next dose. The equation then gives an R of about 1.9. The measured R was 1.7, and the authors found it consistent with the half-life and the twice-daily doses. The concentration fell faster in the first hours after each peak, and such a fall can make the predicted R too high. At steady state, the mean peak was about 2.9 times the mean trough. The simplest model gives about 2.1 for this interval, and the faster early fall can also explain this difference.
5:29Apixaban once or twice daily
In a second study, 36 healthy adults took apixaban once or twice daily for 7 days. With 10 milligrams once daily, the average peak-to-trough ratio was about 8. With 5 milligrams twice daily, the same dose per day, it was about 3.
5:50Summary
In summary, the accumulation ratio is most often the exposure over one interval at steady state divided by the exposure over the first interval. In the simplest model, an interval equal to the half-life gives an R of 2, a shorter interval more, and a longer interval less. With doses every 12 hours, apixaban had a measured R of 1.7, close to the 1.9 that the simplest model predicts from its half-life. At the same daily dose, a longer interval gives a larger peak-to-trough ratio: apixaban had about 8 once daily and 3 twice daily. This concludes lesson 6.3 on repeated doses.
Sources
- Toutain PL, Bousquet-Mélou A. Plasma terminal half-life. J Vet Pharmacol Ther. 2004. PMID 15601438
- Li L, Li X, Xu L, et al. Systematic evaluation of dose accumulation studies in clinical pharmacokinetics. Curr Drug Metab. 2013. PMID 23701162
- Yousef M, Yáñez JA, Löbenberg R, et al. Upholding or breaking the law of superposition in pharmacokinetics. Biomedicines. 2024. PMID 39200307
- Benet LZ, Sodhi JK. Simplifying pharmacokinetics, applying it to drug and dosage form development, and making drug dosage decisions in clinical medicine: the adaptation of Kirchhoff's laws from physics. AAPS J. 2025. PMID 40603610
- Sahin S, Benet LZ. The operational multiple dosing half-life: a key to defining drug accumulation in patients and to designing extended release dosage forms. Pharm Res. 2008. PMID 19015955
- Cui Y, Song Y, Wang J, et al. Single- and multiple-dose pharmacokinetics, pharmacodynamics, and safety of apixaban in healthy Chinese subjects. Clin Pharmacol. 2013. PMID 24353445
- Byon W, Garonzik S, Boyd RA, et al. Apixaban: a clinical pharmacokinetic and pharmacodynamic review. Clin Pharmacokinet. 2019. PMID 31089975
- Frost C, Nepal S, Wang J, et al. Safety, pharmacokinetics and pharmacodynamics of multiple oral doses of apixaban, a factor Xa inhibitor, in healthy subjects. Br J Clin Pharmacol. 2013. PMID 23451769
Illustrations adapted from Servier Medical Art (smart.servier.com), CC BY 4.0. Structures drawn with RDKit.